I’m launching a consumer mobile app in a non-traditional category, it lies somewhere between design, mindfulness and games. I wanted to build a set of short and long term retention benchmarks for the product which sent me on a long hunt for retention numbers for mobile apps. I’m coalescing them in this post for anyone to use [with sources included].
Short Term (D1, D7, D30) Retention
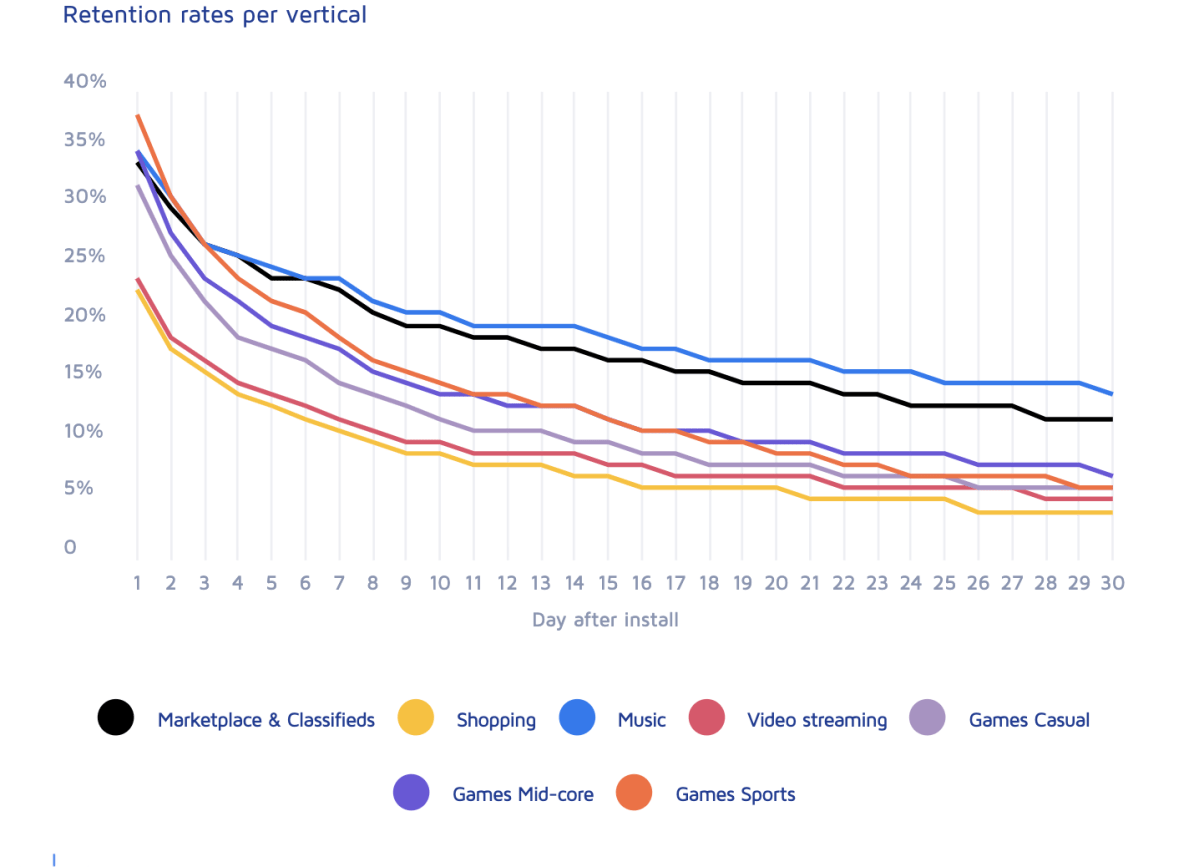
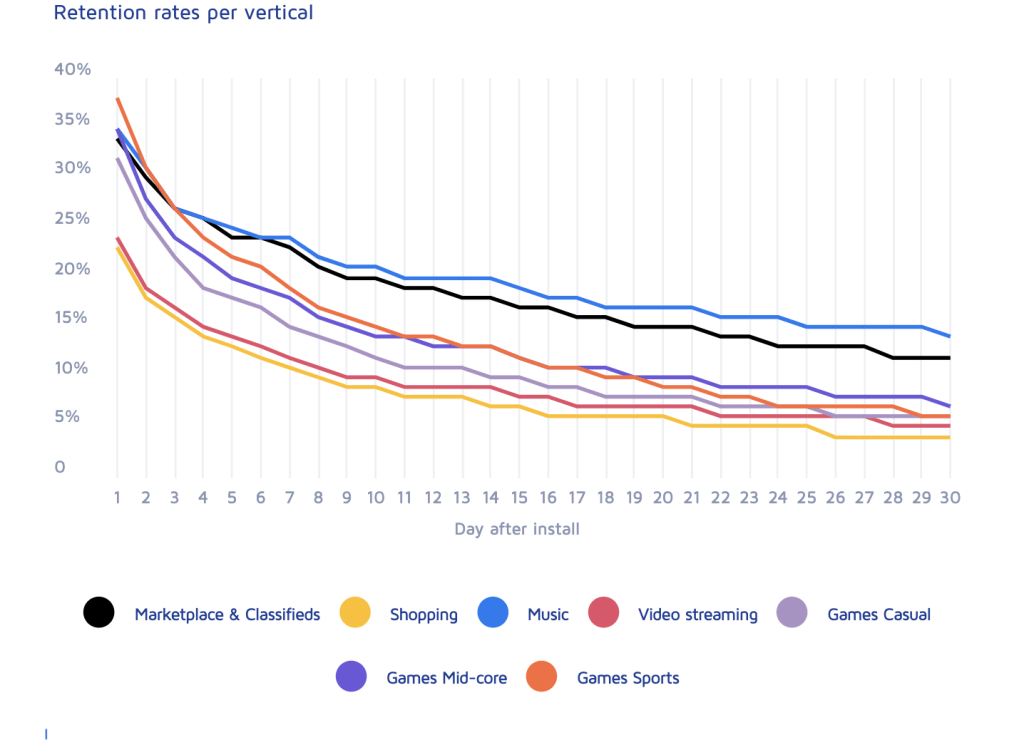
Average across several mobile app categories: Adjust has published their 2020 report with retention curves averaged across categories.
Top 1000 Apps: Averages miss the distribution of retention numbers, so below is the TOP 1000 apps and their benchmarks, however this data is from 2018 but a good enough proxy:

It’s interesting to note the difference between averages and the top 1000 apps. Ex. Casual Games D30 across all apps is 6%, however the top apps are around 12%
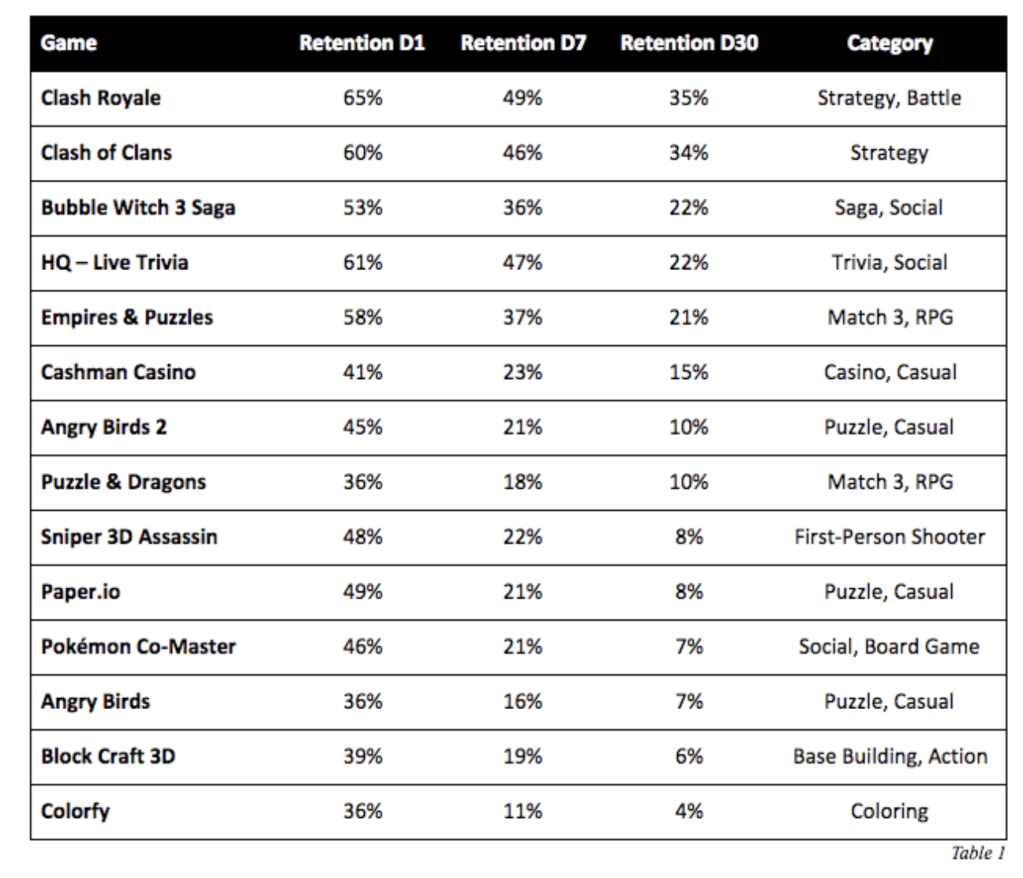
Specific Apps: I found a source with some specific apps skewed towards games:
Hearsay: Retention numbers I’ve heard around the industry/seen on social media.
- For Games: D1 retention 25% (top15% >35%), D7 retention 5% (top15% > 14%), D30 retention 1.5% (top15% > 6%)
- Top social media app retention > Top Dating apps retention > Top Games retention > Top mindfulness/health apps
Long Term Retention (6 month, 12 month)
There is a great post that talks about these benchmarks (https://www.lennyrachitsky.com/p/what-is-good-retention-issue-29). I won’t repost them here.
Other types of Retention
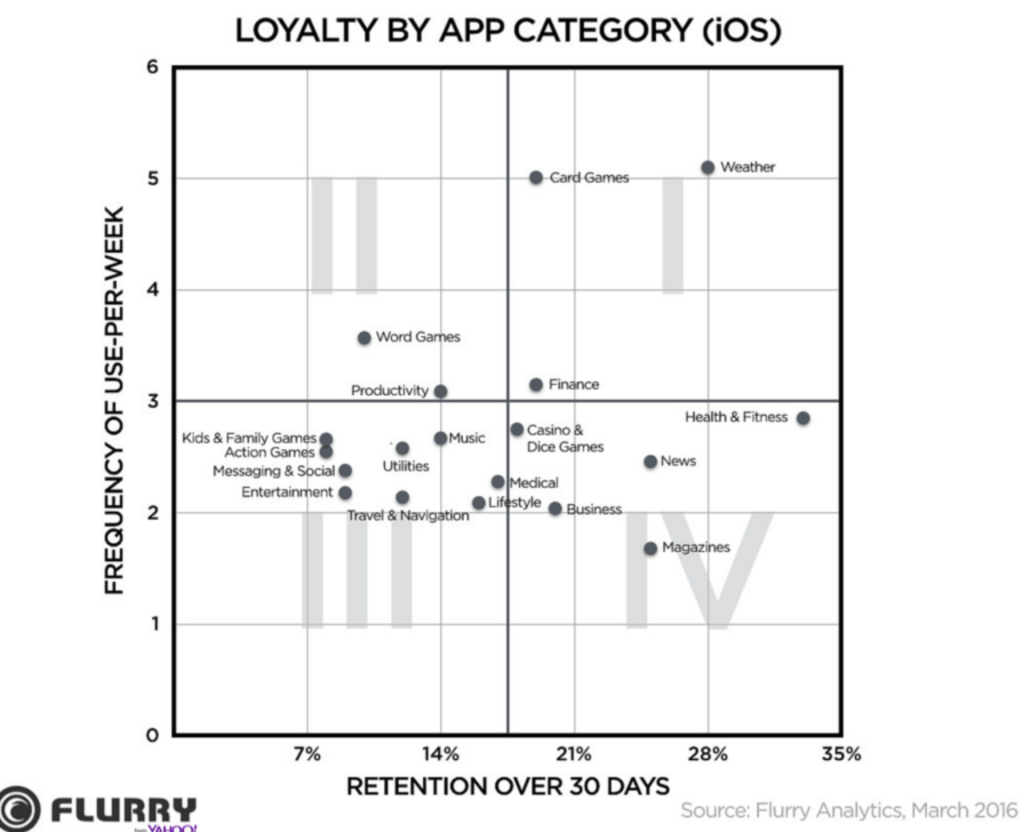
There’s other retention metrics like (Week 1, Week 4, Month 1 etc) that are also helpful for benchmarking but I haven’t found too many good benchmarks around here. However, some back of the napkin math from D1,7,30 and combination with DAU/WAU can help get close to the numbers. Here is a helpful chart (from 2016 data):
Other Resources:
https://mixpanel.com/topics/what-is-a-good-app-retention-rate/
https://www.geckoboard.com/best-practice/kpi-examples/retention-rate/
I hope these are helpful! If you have any retention numbers to share, please reach out and I’d love to add them here. Find me on Linkedin/Twitter!
